Overview
In this project, I analyzed real appointment data from a primary care clinic to identify what drives patient no-shows and built a machine learning model to predict which appointments are at highest risk. This came from a real problem I see working as a Medical Assistant. No-shows waste provider time and are largely preventable with the right outreach.
Dataset
- 52,973 de-identified appointment records (2023–2026)
- Source: EHR export from JinCare Wellness Center (raw data not included)
- Overall no-show rate: 18.16%
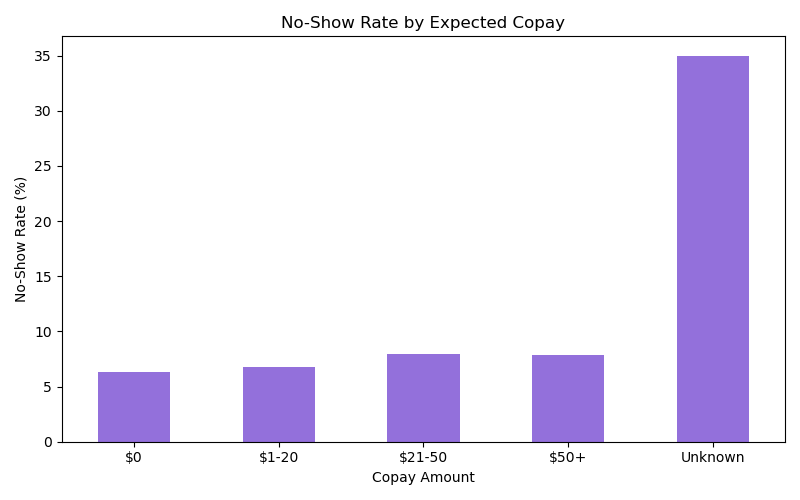
- Features include insurance type, appointment type, age, sex, confirmation status, scheduling channel, chronic disease diagnosis, expected copay, and valid email status
Key Findings
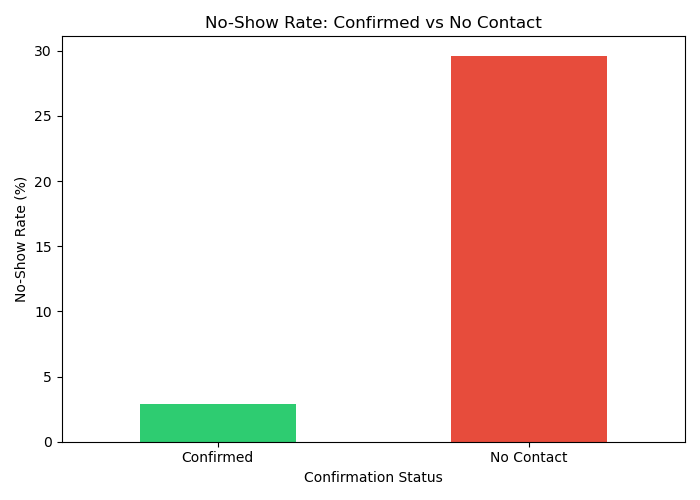
- Confirmed patients had a 2.91% no-show rate vs 29.63% for patients with no contact — a 10x difference
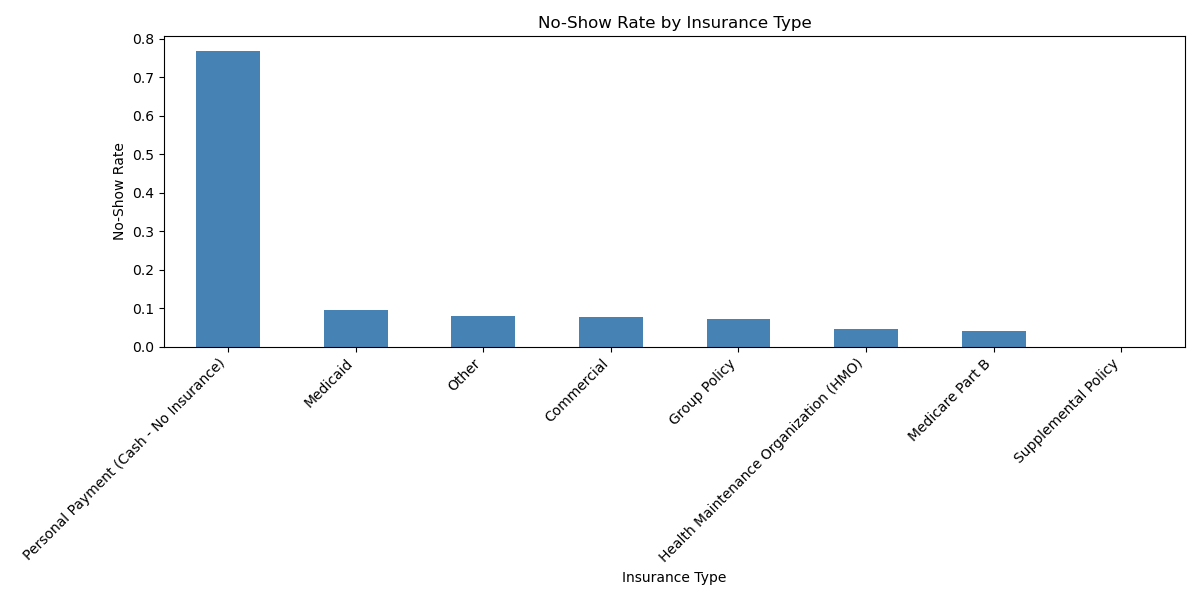
- Uninsured (cash pay) patients had a 77% no-show rate, while Medicare patients were the lowest at around 4–5%
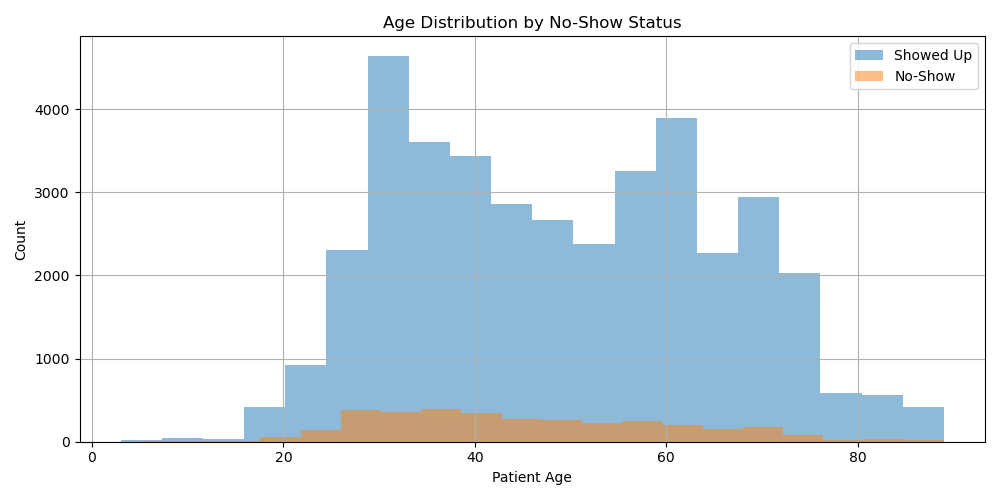
- Younger patients (mean age 45.4) no-showed more than patients who showed up (mean age 49.1, p < 0.0001)
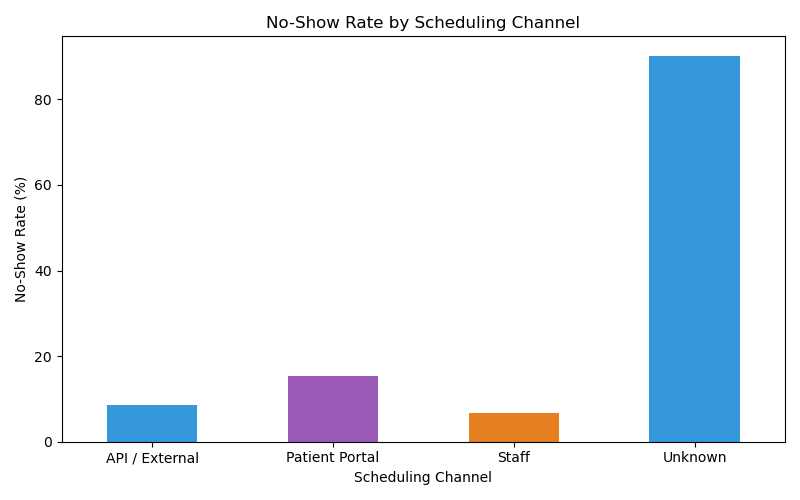
- Staff-scheduled appointments had a 6.8% no-show rate vs 15.3% for patient portal appointments
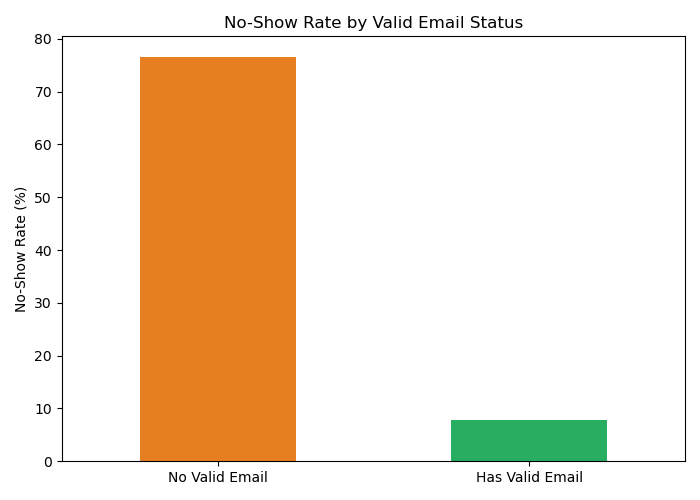
- Patients with no valid email had a 77% no-show rate vs 8% for patients with a valid email, suggesting patients without email contact are largely unreachable through the reminder system
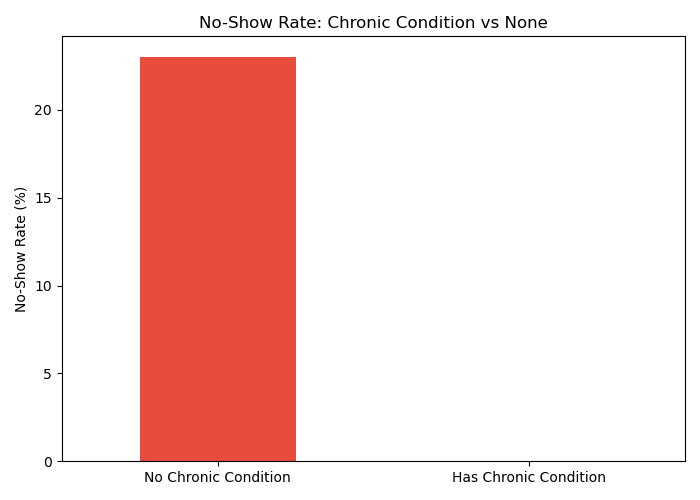
- Patients with chronic conditions (diabetes, hypertension, obesity, etc.) had near-zero no-show rates, while patients without any chronic diagnosis had a 23% no-show rate. This makes clinical sense: patients managing ongoing conditions tend to stay engaged with their care
Visualizations
Statistical Analysis
All predictors except sex were statistically significant (p < 0.05).
Key findings:
- Insurance type, appointment type, confirmation status, age, chronic disease, copay, valid email, and scheduling channel all showed strong associations with no-show behavior (p < 0.0001)
- Sex was the only non-significant predictor (p = 0.35), suggesting no-show behavior is similar between male and female patients
Machine Learning Model
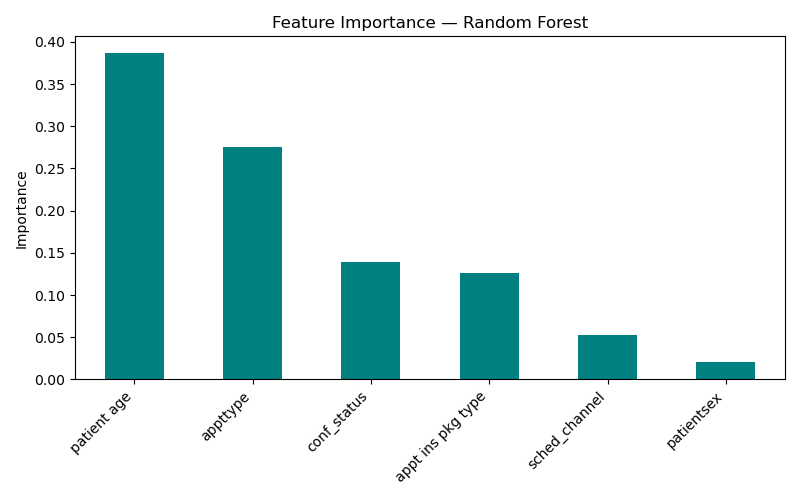
Using patient age, appointment type, confirmation status, insurance type, scheduling channel, chronic disease flag, copay bucket, and valid email as features:
| Model | Accuracy | ROC-AUC |
|---|---|---|
| Logistic Regression | 59.14% | 0.7669 |
| Random Forest + SMOTE | 85.75% | 0.8263 |
| XGBoost + SMOTE | 84.35% | 0.8646 |
| Random Forest (GridSearch tuned) | 86.06% | 0.8382 |
SMOTE was used to address class imbalance (82% showed up vs 18% no-show). GridSearch optimized hyperparameters with 5-fold cross-validation. The CV AUC of 0.9617 reflects performance during training, and the test AUC of 0.8382 is the more meaningful number, since it represents performance on held-out data the model had never seen before. The top predictors were patient age, appointment type, and chronic disease status.
Clinical Application
Beyond the analysis, I built two tools for daily clinical use:
predict_noshow.py— a command-line script that takes the clinic’s EHR schedule, parses each appointment, and outputs a color-coded Excel file with high-risk patients ranked at the topnoshow_risk_tool.html— a browser-based version of the same tool, no coding required. Front desk staff can open it, paste the daily schedule, and instantly see which patients to call first
The goal is to give the front desk a simple way to prioritize outreach calls each morning without needing any technical knowledge.
Tools Used
- Python, pandas, matplotlib, seaborn, scikit-learn, scipy, xgboost, imbalanced-learn